
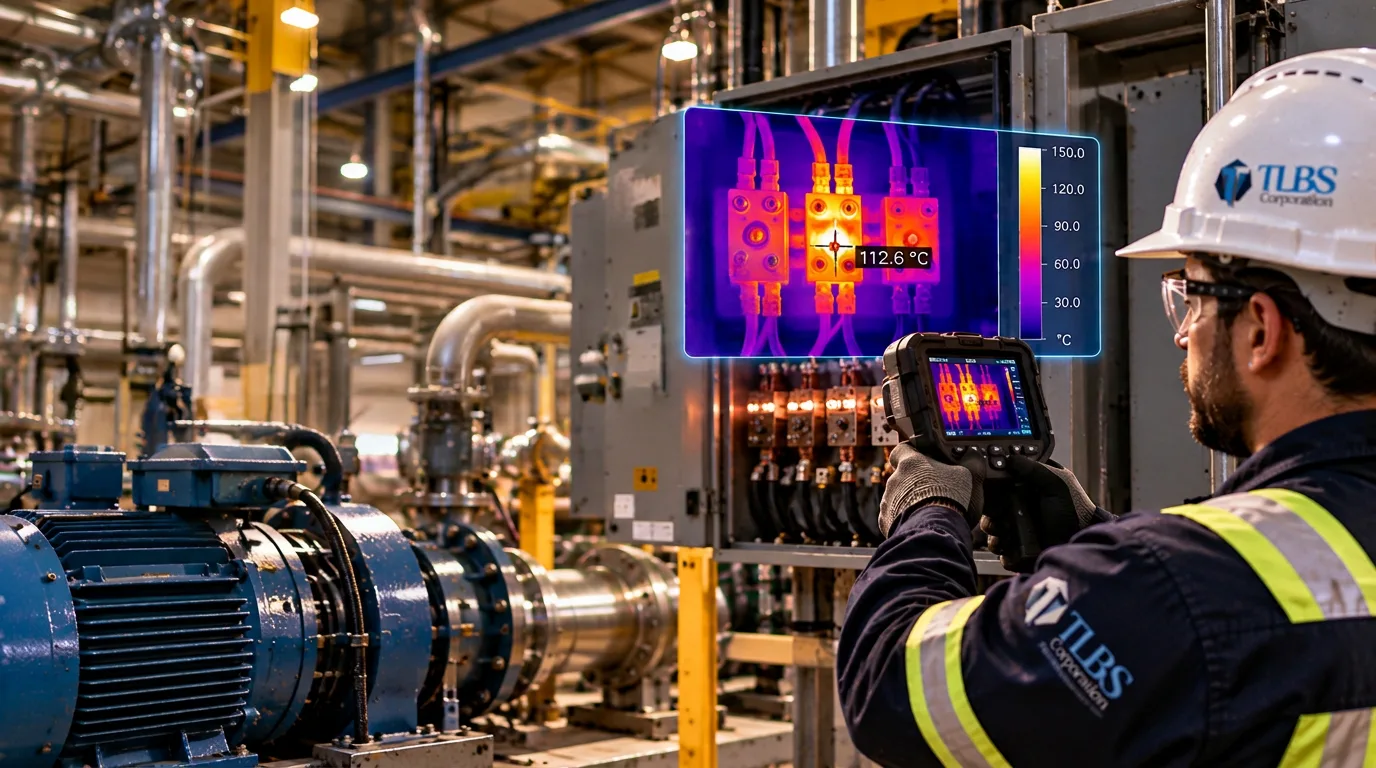

Thermography in Industrial Maintenance: Finding Abnormal Conditions Before They Become Failures
Heat is often one of the earliest visible signatures of developing equipment problems. The challenge is knowing when a temperature difference is normal — and when it is evidence of a developing failure.
Industrial equipment continuously generates, transfers and dissipates heat.
Electrical current produces heat.
Friction produces heat.
Mechanical loading produces heat.
Fluid flow transfers heat.
Insulation controls heat transfer.
Bearings, motors, electrical connections, refractory systems, steam systems, process equipment and rotating machinery all develop characteristic thermal behavior during normal operation.
When operating conditions begin to change, that thermal behavior may change as well.
A loose electrical connection can increase resistance.
A deteriorating bearing can generate additional friction.
Damaged insulation can allow abnormal heat transfer.
An overloaded electrical component can operate above its expected temperature.
A steam trap can fail.
A refractory system can deteriorate.
A process restriction can alter temperature distribution.
In many cases, these abnormalities begin developing before functional failure occurs.
This is where infrared thermography becomes a powerful condition-monitoring technology.
But the objective is not simply to find something hot.
The objective is to determine:
What is thermally abnormal, why is it abnormal, what risk does it represent, and what maintenance decision should follow?
Temperature Is Information
Every operating asset has a thermal pattern influenced by its design, load, environment and operating condition.
Thermography allows maintenance and reliability teams to visualize infrared radiation emitted from surfaces and convert that information into a thermal image.
That image can reveal temperature differences that may not be visible to the human eye.
The basic reliability logic becomes:
Normal Thermal PatternAbnormal TemperatureInvestigationDiagnosisMaintenance Decision
The important word is abnormal.
A component operating at a high temperature is not automatically defective.
And a component operating at a relatively low temperature is not automatically healthy.
The question is whether the observed thermal behavior makes sense for the equipment and its current operating condition.
Thermography Is More Than Finding “Hot Spots”
One of the most common simplifications in infrared inspection is to describe thermography as a method for locating hot spots.
That description is incomplete.
Sometimes the important finding is an unexpectedly hot component.
Sometimes it is an unexpectedly cold component.
Sometimes it is an uneven thermal distribution.
Sometimes it is a temperature difference between comparable components.
Sometimes it is a thermal pattern that has changed over time.
The stronger analytical question is:
“What thermal pattern should exist here — and how does the observed pattern differ from what should be expected?”
That distinction transforms thermography from photography into condition assessment.
Electrical Systems: One of the Most Valuable Applications
Electrical systems are among the most established applications for industrial thermography.
Current flowing through electrical conductors and connections naturally produces heat.
When electrical resistance increases at a connection, additional heat may be generated.
Potential contributors can include:
- loose connections;
- deteriorated contacts;
- corrosion;
- damaged conductors;
- improper termination;
- imbalance;
- overloading;
- defective components;
- or poor contact surfaces.
Thermographic inspection may reveal abnormal temperature differences across:
- switchgear;
- circuit breakers;
- disconnects;
- bus connections;
- electrical panels;
- motor control centers;
- transformers;
- cable terminations;
- contactors;
- and other energized components.
The advantage is significant:
many inspections can be performed while the equipment remains energized and under operating load, provided the work is conducted under appropriate electrical-safety procedures and site requirements.
That allows the inspection to observe the system while it is actually performing its function.
Load Matters
An electrical thermographic inspection performed without understanding load can produce misleading conclusions.
Electrical heating is strongly influenced by current.
A lightly loaded circuit may show little temperature rise even if a connection is beginning to deteriorate.
The same connection under higher load may produce a much more significant thermal response.
Therefore:
Temperature + Electrical Load + Comparative Condition = Better Interpretation
Whenever practical, the thermographer should understand the operating load at the time of inspection.
A thermal image without operating context may tell only part of the story.
Comparison Can Be More Powerful Than Absolute Temperature
In many industrial inspections, one of the most useful techniques is comparison.
Consider a three-phase electrical system operating under reasonably comparable conditions.
If two phases display similar thermal behavior while the third is significantly different, that thermal asymmetry deserves investigation.
Likewise, three similar bearings, connections, cylinders or components performing comparable functions may provide useful reference points.
This creates a practical diagnostic method:
Similar Components + Similar Operating Conditions + Different Thermal Behavior = Investigate
Comparison does not automatically establish the failure mode.
But it can help identify where technical attention should be focused.
Mechanical Equipment Also Produces Thermal Evidence
Thermography is not limited to electrical systems.
Mechanical degradation can change friction, loading and heat generation.
Potential applications include:
- bearings;
- couplings;
- gearboxes;
- motors;
- pumps;
- conveyor systems;
- brakes;
- rotating equipment;
- and other mechanical assemblies.
A bearing experiencing lubrication problems, excessive loading, misalignment or internal degradation may develop abnormal thermal behavior.
But temperature alone should not be used to automatically diagnose the cause.
A hot bearing may indicate several different conditions.
Therefore, a stronger diagnostic process may combine:
Thermography + Vibration Analysis + Lubrication Condition + Operating Data + Physical Inspection
Thermography identifies the thermal symptom.
Other technologies and engineering analysis may be necessary to determine why that symptom exists.
Motors: Electrical and Mechanical Information in One Asset
Electric motors provide a good example of why thermography can support multidisciplinary condition assessment.
Abnormal motor temperatures may be associated with:
- electrical loading;
- voltage imbalance;
- cooling problems;
- ventilation restrictions;
- bearing condition;
- mechanical load;
- environmental temperature;
- contamination;
- or operating duty.
A thermal image may reveal unusual temperature distribution across the motor body, bearings, electrical connections or cooling surfaces.
But again:
A thermal anomaly is evidence. It is not automatically a diagnosis.
The maintenance team must connect the thermal pattern with the motor’s electrical, mechanical and operational condition.
Steam Systems and Steam Traps
Steam systems represent another valuable application.
A functioning steam trap should produce thermal behavior consistent with its design, steam pressure, condensate load and operating state.
A failed trap may produce a thermal pattern suggesting:
- continuous steam passage;
- blockage;
- inadequate condensate discharge;
- or another abnormal operating condition.
Thermography can help identify candidates for further investigation.
When combined with ultrasound and process knowledge, inspection confidence can improve substantially.
This reinforces a broader condition-monitoring principle:
Different technologies often become more powerful when they confirm one another.
Insulation and Refractory Systems
Thermography can also reveal abnormal heat transfer through equipment surfaces.
Applications may include:
- furnaces;
- boilers;
- heaters;
- kilns;
- reactors;
- insulated piping;
- tanks;
- vessels;
- ducts;
- and refractory-lined equipment.
Damaged insulation or refractory deterioration can create localized external temperature differences.
These thermal patterns may help identify areas where heat is escaping or where the thermal barrier is no longer performing as expected.
The consequences can extend beyond energy loss.
Depending on the equipment, refractory or insulation deterioration may affect:
- personnel safety;
- structural integrity;
- process efficiency;
- equipment life;
- surrounding components;
- and operational reliability.
Early identification can therefore provide important planning time.
Boilers and Heat-Transfer Equipment
Boilers, heaters and other thermal-process equipment operate through controlled heat transfer.
Abnormal thermal patterns can sometimes provide evidence of:
- refractory deterioration;
- insulation damage;
- burner irregularities;
- fouling;
- flow distribution problems;
- localized overheating;
- or process abnormalities.
However, interpretation requires knowledge of the equipment design.
A temperature difference that appears abnormal on one boiler configuration may be completely normal on another.
This is why thermographic analysis should always begin with an understanding of:
Equipment DesignExpected Thermal BehaviorActual Thermal PatternDeviation
Without knowing what normal should look like, abnormal becomes difficult to define.
Process Systems: Sometimes Cold Is the Problem
Thermography is frequently associated with excessive heat.
But industrial process problems may also appear as unexpectedly cold regions.
Examples can include:
- restricted flow;
- blocked lines;
- improper valve operation;
- liquid levels;
- condensation behavior;
- failed heating systems;
- process distribution problems;
- or unexpected heat loss.
This is why the inspection objective should not be:
“Find hot equipment.”
It should be:
“Identify thermal behavior inconsistent with the expected process or equipment condition.”
Thermal Patterns Can Help Locate Fluid Levels
In some tanks and vessels, differences in heat-transfer behavior between vapor and liquid regions can create visible thermal boundaries.
Under suitable conditions, thermography may help indicate:
- liquid level;
- sludge accumulation;
- interface conditions;
- or process behavior.
However, success depends heavily on temperature differences, environmental conditions, vessel construction, insulation and process characteristics.
Thermography should therefore be treated as a diagnostic tool whose effectiveness depends on the physics of the specific application.
Emissivity Matters
One of the most important technical considerations in infrared thermography is emissivity.
Different surfaces emit infrared radiation differently.
Painted surfaces, oxidized metals and nonmetallic materials may behave very differently from polished or reflective metals.
If emissivity is not properly considered, temperature measurements can be inaccurate.
This creates a fundamental rule:
The camera measures infrared radiation. The analyst must understand the surface producing that radiation.
Thermal images may look visually convincing even when the numerical temperature measurement is misleading.
A professional thermographic inspection therefore requires understanding the material and surface condition being observed.
Reflections Can Create False Thermal Anomalies
Reflective surfaces create another major challenge.
Shiny metals can reflect infrared radiation from:
- the sun;
- nearby hot equipment;
- personnel;
- piping;
- furnaces;
- or other surrounding sources.
The camera may display this reflected energy as if it were originating from the inspected component.
This can create false indications.
An experienced thermographer therefore asks:
Is this heat being emitted by the target — or reflected from somewhere else?
Changing the inspection angle, comparing adjacent surfaces and understanding the surrounding thermal environment can help distinguish real anomalies from reflections.
Distance, Angle and Atmosphere Affect the Measurement
Thermographic measurement quality can also be influenced by:
- distance to the target;
- viewing angle;
- atmospheric conditions;
- humidity;
- steam;
- dust;
- rain;
- wind;
- direct solar loading;
- and intervening materials.
Infrared cameras do not see through most solid materials.
They primarily detect radiation from visible surfaces.
A thermal pattern on the exterior of equipment therefore represents surface behavior, which must then be interpreted in relation to what may be occurring internally.
Again:
The image is the beginning of the analysis — not the end.
Environmental Conditions Matter
Outdoor inspections introduce additional variables.
Solar radiation can heat equipment surfaces.
Wind can cool them.
Rain can dramatically alter surface temperature.
Ambient temperature can influence thermal contrast.
Equipment inspected early in the morning may display a different thermal pattern from the same equipment inspected during peak afternoon solar loading.
Therefore, environmental conditions should be documented when they can materially influence interpretation.
A mature thermography program records context — not just images.
Baselines Improve Interpretation
As with vibration analysis, baseline information can significantly improve thermographic assessment.
A baseline thermal image captured when equipment is known to be operating normally provides a useful reference for future comparison.
Over time, the organization can evaluate:
BaselineChangeTrendInvestigationDecision
This can be particularly useful for critical electrical equipment, motors, bearings and thermal-process systems.
The objective is not simply to compare temperatures.
It is to identify meaningful changes in thermal behavior.
Trending Can Reveal Developing Problems
A component may not yet exceed an alarm or action criterion, but its temperature may be increasing over successive inspections.
That trend can be important.
For example:
Inspection 1 → stable.
Inspection 2 → small increase.
Inspection 3 → further increase.
Inspection 4 → clear abnormality.
A trend provides information that a single snapshot cannot.
This creates a familiar reliability principle:
A measurement tells us where the asset is.
A trend can help tell us where the condition is going.
That information can create valuable planning time.
Severity Should Consider More Than Temperature Difference
It is tempting to rank thermographic findings exclusively according to temperature difference.
But maintenance priority should consider more than ΔT.
A more complete assessment may include:
Thermal Severity + Asset Criticality + Failure Consequence + Load + Rate of Change + Operating Context
A moderate thermal anomaly on a highly critical asset may deserve more immediate attention than a larger anomaly on redundant, low-consequence equipment.
Therefore:
Temperature does not determine maintenance priority by itself.
Risk and operational consequence matter.
Thermography Should Connect to Asset Criticality
This connection is fundamental.
A thermographic program should not treat every thermal anomaly equally.
Consider two electrical connections showing similar abnormal heating.
Connection A feeds a noncritical redundant system.
Connection B supplies a process whose loss could shut down production.
The thermal condition may be similar.
The operational consequence is not.
The decision architecture becomes:
Thermal AnomalyTechnical EvaluationAsset CriticalityFailure ConsequenceMaintenance Priority
This is how condition monitoring becomes part of reliability management rather than an isolated inspection activity.
Thermography and the P–F Interval
Thermography can support Condition-Based Maintenance when a developing failure creates a detectable thermal change before functional failure occurs.
The sequence becomes:
Developing FailureDetectable Thermal ChangeDiagnosisWarning TimePlanned Intervention
The value of the inspection depends on discovering the condition early enough to act.
If the organization detects an abnormal electrical connection but does not evaluate the finding until after the component fails, the inspection created information — but not reliability.
The purpose is to convert detection into decision time.
Inspection Frequency Must Match Risk
Annual thermographic inspections are common in many facilities.
But annual frequency should not automatically be considered correct for every asset.
Inspection frequency should consider:
- asset criticality;
- failure history;
- operating environment;
- load;
- equipment age;
- known degradation mechanisms;
- previous findings;
- regulatory or insurance requirements;
- and how quickly relevant failures can develop.
Some equipment may justify more frequent inspection.
Other equipment may justify less.
The inspection interval should reflect risk and failure behavior rather than tradition alone.
A Thermal Anomaly Should Lead to a Defined Workflow
Finding an abnormal temperature is only the beginning.
A disciplined process may follow:
DetectionValidationDiagnosisRisk EvaluationRecommendationWork OrderPlanningRepairVerification
Each step matters.
Detection
An abnormal thermal pattern is identified.
Validation
Confirm that the anomaly is real and not caused by reflection, load difference, environmental effects or measurement error.
Diagnosis
Determine plausible technical causes.
Risk Evaluation
Consider asset criticality and consequences.
Recommendation
Define the appropriate action and timeframe.
Execution
Perform the required maintenance or engineering intervention.
Verification
Reinspect to confirm that the abnormal condition has been corrected.
This closes the reliability loop.
Verification After Repair Is Essential
Imagine that thermography identifies abnormal heating at an electrical connection.
The maintenance team repairs the connection.
Is the job finished?
Mechanically, perhaps.
From a reliability perspective, one important step remains:
Verify the thermal condition after the repair.
Did the temperature difference disappear?
Is the load comparable?
Is the repaired connection now behaving similarly to the other phases?
Verification confirms whether the maintenance intervention actually corrected the detected condition.
The complete loop becomes:
DetectDiagnoseDecideRepairVerifyLearn
Thermography Should Integrate With the CMMS
Thermographic findings create greater organizational value when they are connected with maintenance history.
Useful information may include:
- asset identification;
- inspection date;
- operating condition;
- load;
- thermal images;
- temperature measurements;
- anomaly classification;
- suspected cause;
- maintenance recommendation;
- work-order reference;
- corrective action;
- and post-repair verification.
This information can help identify:
- recurring problems;
- bad actors;
- repeated electrical issues;
- insulation deterioration;
- chronic overheating;
- and opportunities for engineering improvement.
The CMMS then becomes part of the condition-monitoring learning system.
Avoid the “Pretty Picture” Problem
Modern infrared cameras can produce impressive images.
But visually dramatic thermal images can create a dangerous illusion of certainty.
A colorful image does not automatically mean the analysis is correct.
Professional thermography depends on:
- proper inspection technique;
- equipment knowledge;
- thermal physics;
- operating context;
- correct camera configuration;
- understanding emissivity;
- recognizing reflections;
- comparative analysis;
- and engineering judgment.
The value is not the image.
The value is the decision supported by the image.
Multiple Technologies Strengthen Diagnosis
The strongest condition-monitoring programs rarely depend on a single technology.
Consider a motor bearing showing increased temperature.
Thermography identifies abnormal heat.
Vibration analysis identifies changing bearing-related vibration.
Oil analysis identifies wear debris.
Operating data confirms increased mechanical load.
Together, those findings create much greater diagnostic confidence.
The architecture becomes:
Thermography + Vibration + Lubrication + Electrical Data + Process Data + Inspection History
This is not about collecting every possible measurement.
It is about using the appropriate evidence to understand the failure mode.
Thermography Can Support Safety — But Safety Comes First
Infrared inspection can allow evaluation of energized and operating equipment without physical contact with the inspected surface.
That can be valuable.
But noncontact measurement does not mean risk-free inspection.
Electrical systems, rotating machinery, high-temperature equipment, pressurized systems and operating plants present serious hazards.
Inspection activities must respect:
- electrical safety requirements;
- arc-flash boundaries;
- PPE requirements;
- site procedures;
- safe access;
- equipment guarding;
- operating restrictions;
- and applicable work controls.
No thermal image justifies unsafe positioning.
Condition monitoring must never create a greater risk than the condition being monitored.
The Economics of Early Thermal Detection
The economic value of thermography comes from what early detection allows the organization to avoid or control.
A developing electrical problem identified early may allow maintenance to be scheduled before a breaker, conductor or connection fails.
A deteriorating bearing may be investigated before secondary damage occurs.
Damaged insulation may be repaired before energy losses or equipment deterioration increase.
A steam-system problem may be corrected before unnecessary energy consumption continues for months.
Early detection can create time to:
- verify the problem;
- order materials;
- coordinate production;
- plan labor;
- schedule the intervention;
- avoid emergency procurement;
- reduce secondary damage;
- and select a controlled maintenance window.
Once again:
Detection creates time.
Time creates options.
Options improve maintenance decisions.
Artificial Intelligence Will Improve Thermal Analysis
Artificial intelligence and computer vision are increasingly capable of assisting with:
- thermal-image classification;
- anomaly recognition;
- automated comparison;
- pattern detection;
- asset identification;
- and trend analysis.
Fixed thermal cameras and robotic inspection platforms may further expand continuous or remote thermal monitoring.
These technologies can increase inspection scale and consistency.
But they do not eliminate the fundamental engineering questions:
Is the measurement valid?
What operating condition existed?
Is this an actual anomaly?
What failure mode could explain it?
What is the consequence?
What action is justified?
AI may accelerate analysis.
Engineering judgment still determines what the finding means to the operation.
The TLBS Perspective
At TLBS Corporation — Engineering, Projects & Maintenance, thermography is not viewed as a standalone imaging service.
It is part of a broader condition-based reliability process.
The objective is to connect:
Asset CriticalityFailure ModeThermal BehaviorTechnical DiagnosisMaintenance DecisionPlanned InterventionVerification
That connection transforms infrared inspection into actionable maintenance intelligence.
A thermal image alone does not protect an industrial operation.
The decision made from reliable thermal evidence can.
A Strategic Question for Industrial Leaders
Ask your maintenance and reliability organization:
“When a thermal anomaly is identified, can we explain why it is abnormal, what failure mode it may represent, what operational consequence exists, and what action should follow?”
If the answer is simply:
“This component is hot.”
the analysis may not yet be complete.
The objective is to move beyond finding heat.
The objective is to understand what the thermal behavior means to the asset and to the operation.
Final Perspective
Infrared thermography gives maintenance teams something extremely valuable:
the ability to see thermal behavior that the human eye cannot see.
But seeing an anomaly is only the beginning.
The strongest thermography programs connect:
thermal patterns, equipment condition, operating context, failure modes, asset criticality and maintenance decisions.
They do not ask only:
“Where is the heat?”
They ask:
What changed?
Why is it different?
What could it mean?
What happens if it progresses?
And when should we intervene?
That is the difference between taking thermal images and using thermography as a reliability strategy.
See the abnormal condition.
Understand what it means.
Act before it becomes failure.
TLBS Corporation
Engineering, Projects & Maintenance